Announcing the 2024 Put Us on the Map Challenge Selected Cities
Apr. 5, 2024
Caleigh Paster
For communities across the country, data can be a gamechanger. Data can help illuminate challenges, inform solutions, and improve strategies to meet the needs of the people city leaders serve. Here at the Dashboard, we hope that by putting data in the hands of community advocates, leaders, and changemakers, we can help drive systemic, equitable, and long-lasting change to improve health and well-being nationwide.
We launched the Put Us on the Map Challenge in 2022. Since our inaugural Challenge, over 90 cities have been added to the Dashboard, with populations ranging from 3,000 to 50,000. Today, we’re sharing a few of these stories to demonstrate the value of making it on the City Health Dashboard map.
Finding Focus Areas in the Maplewood, NJ Health Department
The Maplewood Health Department utilized the City Health Dashboard Health Outcomes data to advocate for an increase in more equitable health programming, redefining their focus areas towards injury prevention, disability advocacy, and young adult drug and alcohol overdose prevention. As part of this data-focused shift, the town is expanding partnerships across the community to bring programs like health screenings, mobile vaccination vans, and overdose prevention education initiatives directly to priority neighborhoods.
Successes and Challenges for Civic Matchmaking in Nacogdoches, TX
The Hospice of East Texas in Nacogdoches, TX partnered with various agencies to launch a civic matchmaking program for retirees later in 2024. They plan to use Dashboard data to identify community strengths and opportunity areas related to health. These community assessment findings will be incorporated into the curriculum and communicated to matchmaking program participants.
Data as a Toolkit for the Mayors Wellness Campaign in Stafford, NJ
Stafford Township used City Health Dashboard data on Frequent Mental Distress, Obesity, Diabetes, High Blood Pressure, Cardiovascular Disease Deaths, and Physical Environment metrics, along with local community health surveys and resident feedback, to develop effective programs that serve the needs of residents. As part of the Township’s Mayor’s Wellness Campaign, these data have augmented mental health workshops, a health benefits fair, and an environmental advocacy fair.
The Road to Emergency Medical Services Prevention in Decatur, GA
The Fire Rescue team in Decatur, GA combined local data on emergency medical service responses with City Health Dashboard data, such as Housing with Potential Leak Risk, Physical Inactivity, Neighborhood Racial/Ethnic Segregation, and Frequent Mental Distress, to understand potential underlying causes of these emergencies and target prevention efforts. Using these data as evidence for the Metro-Area Cities Wellness initiative, the city plans to implement programming using the help of this funding opportunity to support vulnerable populations.
Congratulations to the 2024 Selected Cities
The 3rd annual City Health Dashboard Put Us on the Map Challenge was a big success! This year we expanded the selection criteria to allow for cities with populations as small as 1,000 to join the Dashboard (previously 3,000). We received many competitive applicants and are excited to announce the 51 communities selected for this year’s Challenge:
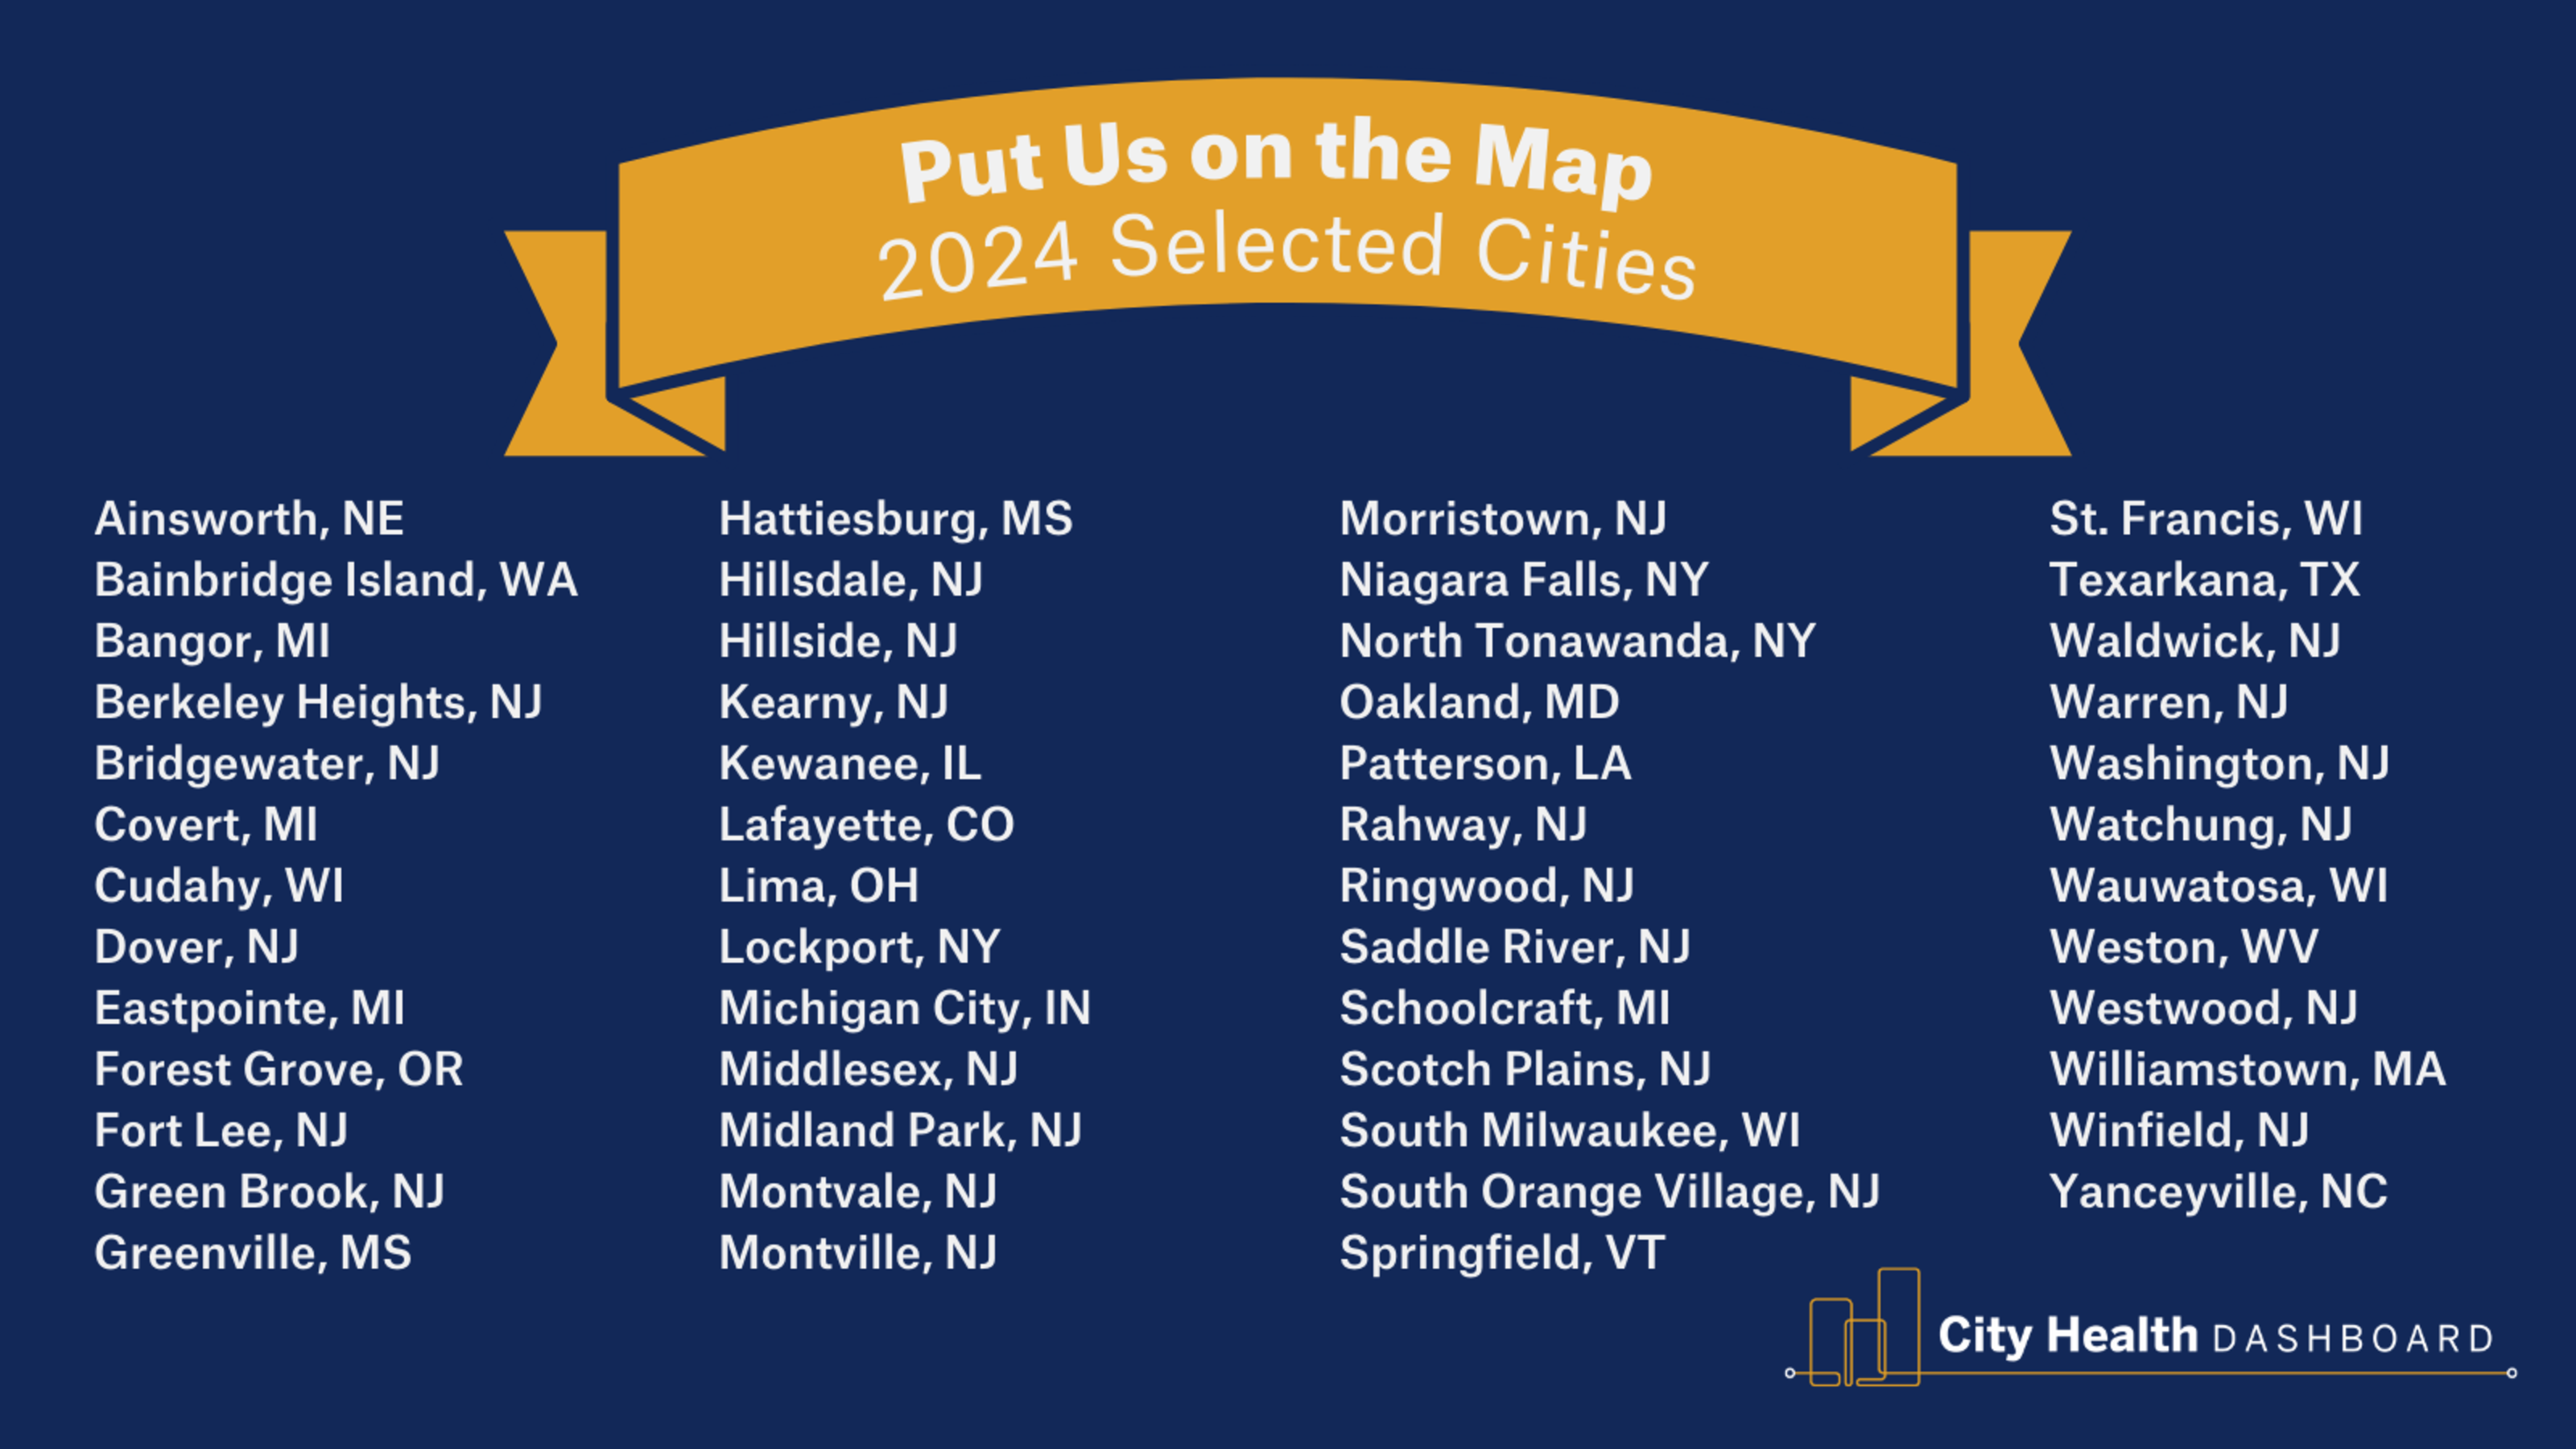
This year brought a diverse set of applicants. Cities ranged from 1,400 to 48,000 population, each bringing with them challenges and goals for health in their communities. While each city chose a different focus area for their application, every applicant was clear in their need for easily accessible, localized data to help support efforts to improve health and equity for residents. When we asked these cities how they envision using the data, some responses, in particular, stood out: Patterson, LA is looking forward to combining Dashboard data with machine learning for predictive analyses on health outcomes in their community; Wauwatosa, WI plans to use the data to complement local surveys as they embark upon their Community Health Assessment and Community Health Improvement Plan; and Eastpointe, MI wants to look at local data and the social determinants of health within the context of historical redlining, the financial crisis, and the COVID-19 pandemic to create data-driven goals and policy decisions for their majority-Black and majority-Woman city. We look forward to seeing how each of these cities will use the Dashboard data over the coming years!
Each selected city will be added to the City Health Dashboard in summer 2024 and will have new access to city- and neighborhood-level data, as well as in-kind technical support from the Dashboard team. The cities will be able to use all the site’s features like exploring metric maps, comparing metrics within their city, or to other Dashboard cities, viewing demographic maps, accessing Take Action resources, and more. Local impact stories using Dashboard data will also be featured on the site to inspire other city leaders eager to put data into action across the country.
The Put Us on the Map Challenge is just the beginning for these smaller cities as they embark on their data journeys. We look forward to working with them over the next year to build data capacity and elevate their work to advance health and equity locally!
If you are interested in joining the Dashboard, fill out the City Interest form and we will contact you when the next round of Put Us on the Map Challenge applications goes live.