City Types for Improving Health and Equity in Small and Midsize Cities
Links
Full Report
Report Fact Sheet
Press Release
Full City List
Launch Webinar Recording
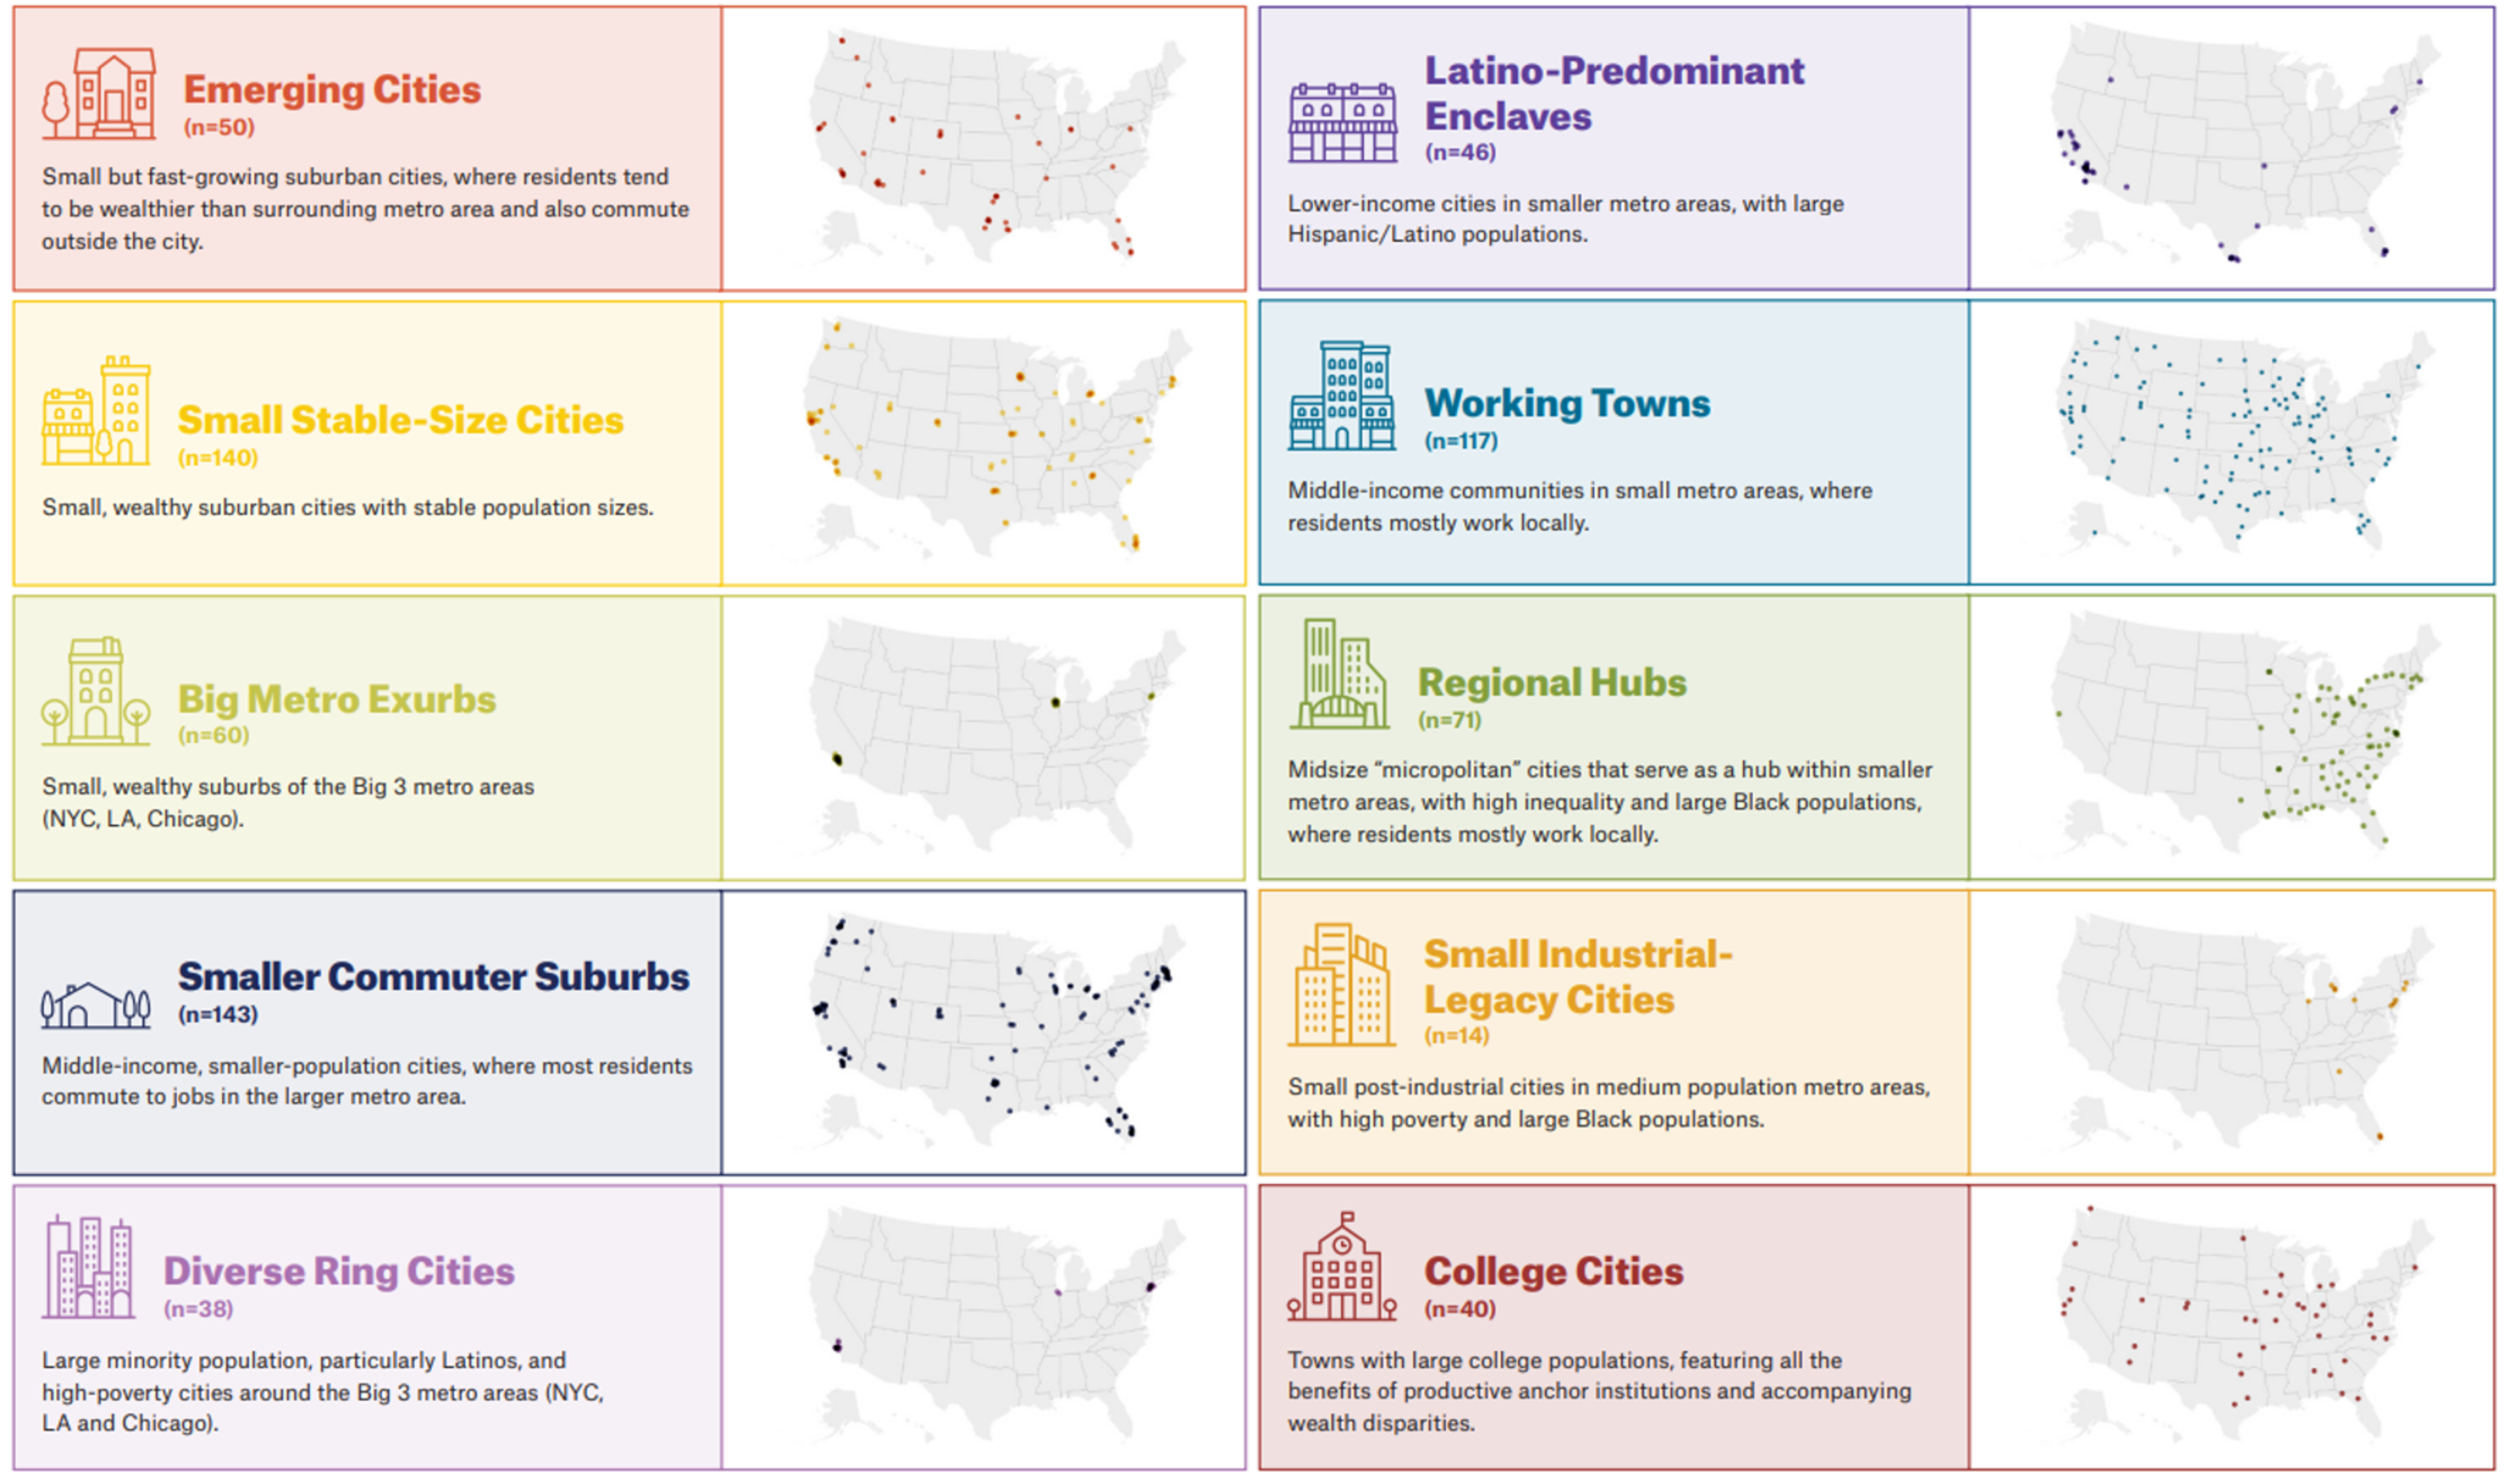
America’s small and midsize cities face many of the same health disparities that larger cities do. Their challenges don’t get the same attention or resources, yet these cities—more than 700 of them—are home to far more people. With support from the Robert Wood Johnson Foundation, we created the new City Types framework that categorized 719 cities – those with populations of 50,000 to 500,000 - into ten discrete City Types based on population, commuting patterns, poverty, and more. The goal is to help city leaders and their partners understand how health disparities in their communities are driven by social factors like income inequality and rent burden.
A full report – City Types for Improving Health and Equity: Understanding America’s Small and Midsize Cities – describes the City Types in greater detail, as well as what we learned by analyzing the social drivers of health within and across these types.
Defining City Types
City Types Data Explorer
The Data Explorer allows you to dive into selected measures used in the report, as well as search for your city, to see how measures vary within City Types and also across the different categories.
Credit Insecurity Index by City Type
TIP: Let’s walk through an example to explain how to use the Data Explorer.
Select Poverty Rate as the measure from the drop-down menu. The City Type names are lined up on the left hand side, and each colored dot represents a city. Hover over the dots to see different city names and the poverty rate in that city. Around the dots for each City Type there is a boxplot, the black rectangle divided into two parts with whiskers on either side. The line inside the rectangle shows the median value for cities in that Type, and the rectangle represents the middle 50% of values for the City Type. The whiskers show the full range of values for that Type. The full range and average of values for all City Types is across the bottom of the chart (the x-axis).
Next, type in Shreveport, LA in the Find a City box. You’ll see Shreveport identified in the Regional Hubs City Type with a black circle around it, and by hovering over the city’s dot, you’ll see the city’s poverty rate is 25.7%. Now you can see that Shreveport is slightly above the median value of all cities in Regional Hubs, and that Regional Hubs have one of the highest poverty rates among the City Types, with only Small Industrial-Legacy Cities and College Towns having higher poverty as a group.
For further examples of using the Data Explorer to drive local action, see our blog post on City Types.
Key Findings & Recommendations
The report details findings about health and equity in small and midsize cities including how poverty and racial inequities play an outsized role in the health of city residents. Our key findings include:
Region and proximity to bigger cities drive local socioeconomic disparities.
Cities are divided by economic and racial/ethnic measures, but wealth is concentrated in cities that are predominantly White.
Poverty, rent burden, and income inequality grew across all City Types.
Health outcomes track closely with socioeconomic disparities most of the time.

For city leaders, the lessons from these findings are clear:
Equity must be addressed head-on. Cities can influence policies and programs that impact racial inequality, such as zoning, affordable housing, the composition of school districts, and policing.
Optimizing municipal autonomy and flexibility in the face of regional fiscal and policy constraints is critical to effective city leadership and action on health. For example, although increases in minimum wage have been shown to improve health among vulnerable Americans, 25 states prohibit cities from increasing the minimum wage. To support the adoption of new and purposeful approaches to advancing local health, local governance and authority must be respected and strengthened.
Building networks of peer cities that reflect shared characteristics beyond the usual state, regional, or population size groupings can drive new agenda-setting policies and improve well-being.
As governments everywhere combat immediate and long-running health challenges, the City Types framework provides a data-driven foundation for sharpening understanding of small and midsize cities to inform local policy solutions that improve health and well-being.
Download the report, explore the data, and email us with any questions.
Find your City on the Dashboard
All cities with populations 50,000 and greater are on the City Health Dashboard, so you can see measures of health and equity in more detail. Head to the City Health Dashboard homepage to start exploring your city. [Note that some cities, especially smaller cities, do not have the complete set of measures due to underlying data availability.]