Contextualizing Rising Chronic Absenteeism Trends
Jan. 24, 2024
Anne Vierse
The Dashboard calculates Chronic Absenteeism as the percent of public-school students who miss 10% or more school days of the academic year. Research has established that reducing Chronic Absenteeism can help ensure better education and health outcomes.1 Being present at school provides students access to a range of learning experiences and essential resources such as social and emotional supports, food and nutrition, and health care.2 As with all metrics on the Dashboard, understanding the social, economic, and political factors within a community is key to adding context and interpreting Chronic Absenteeism numbers.
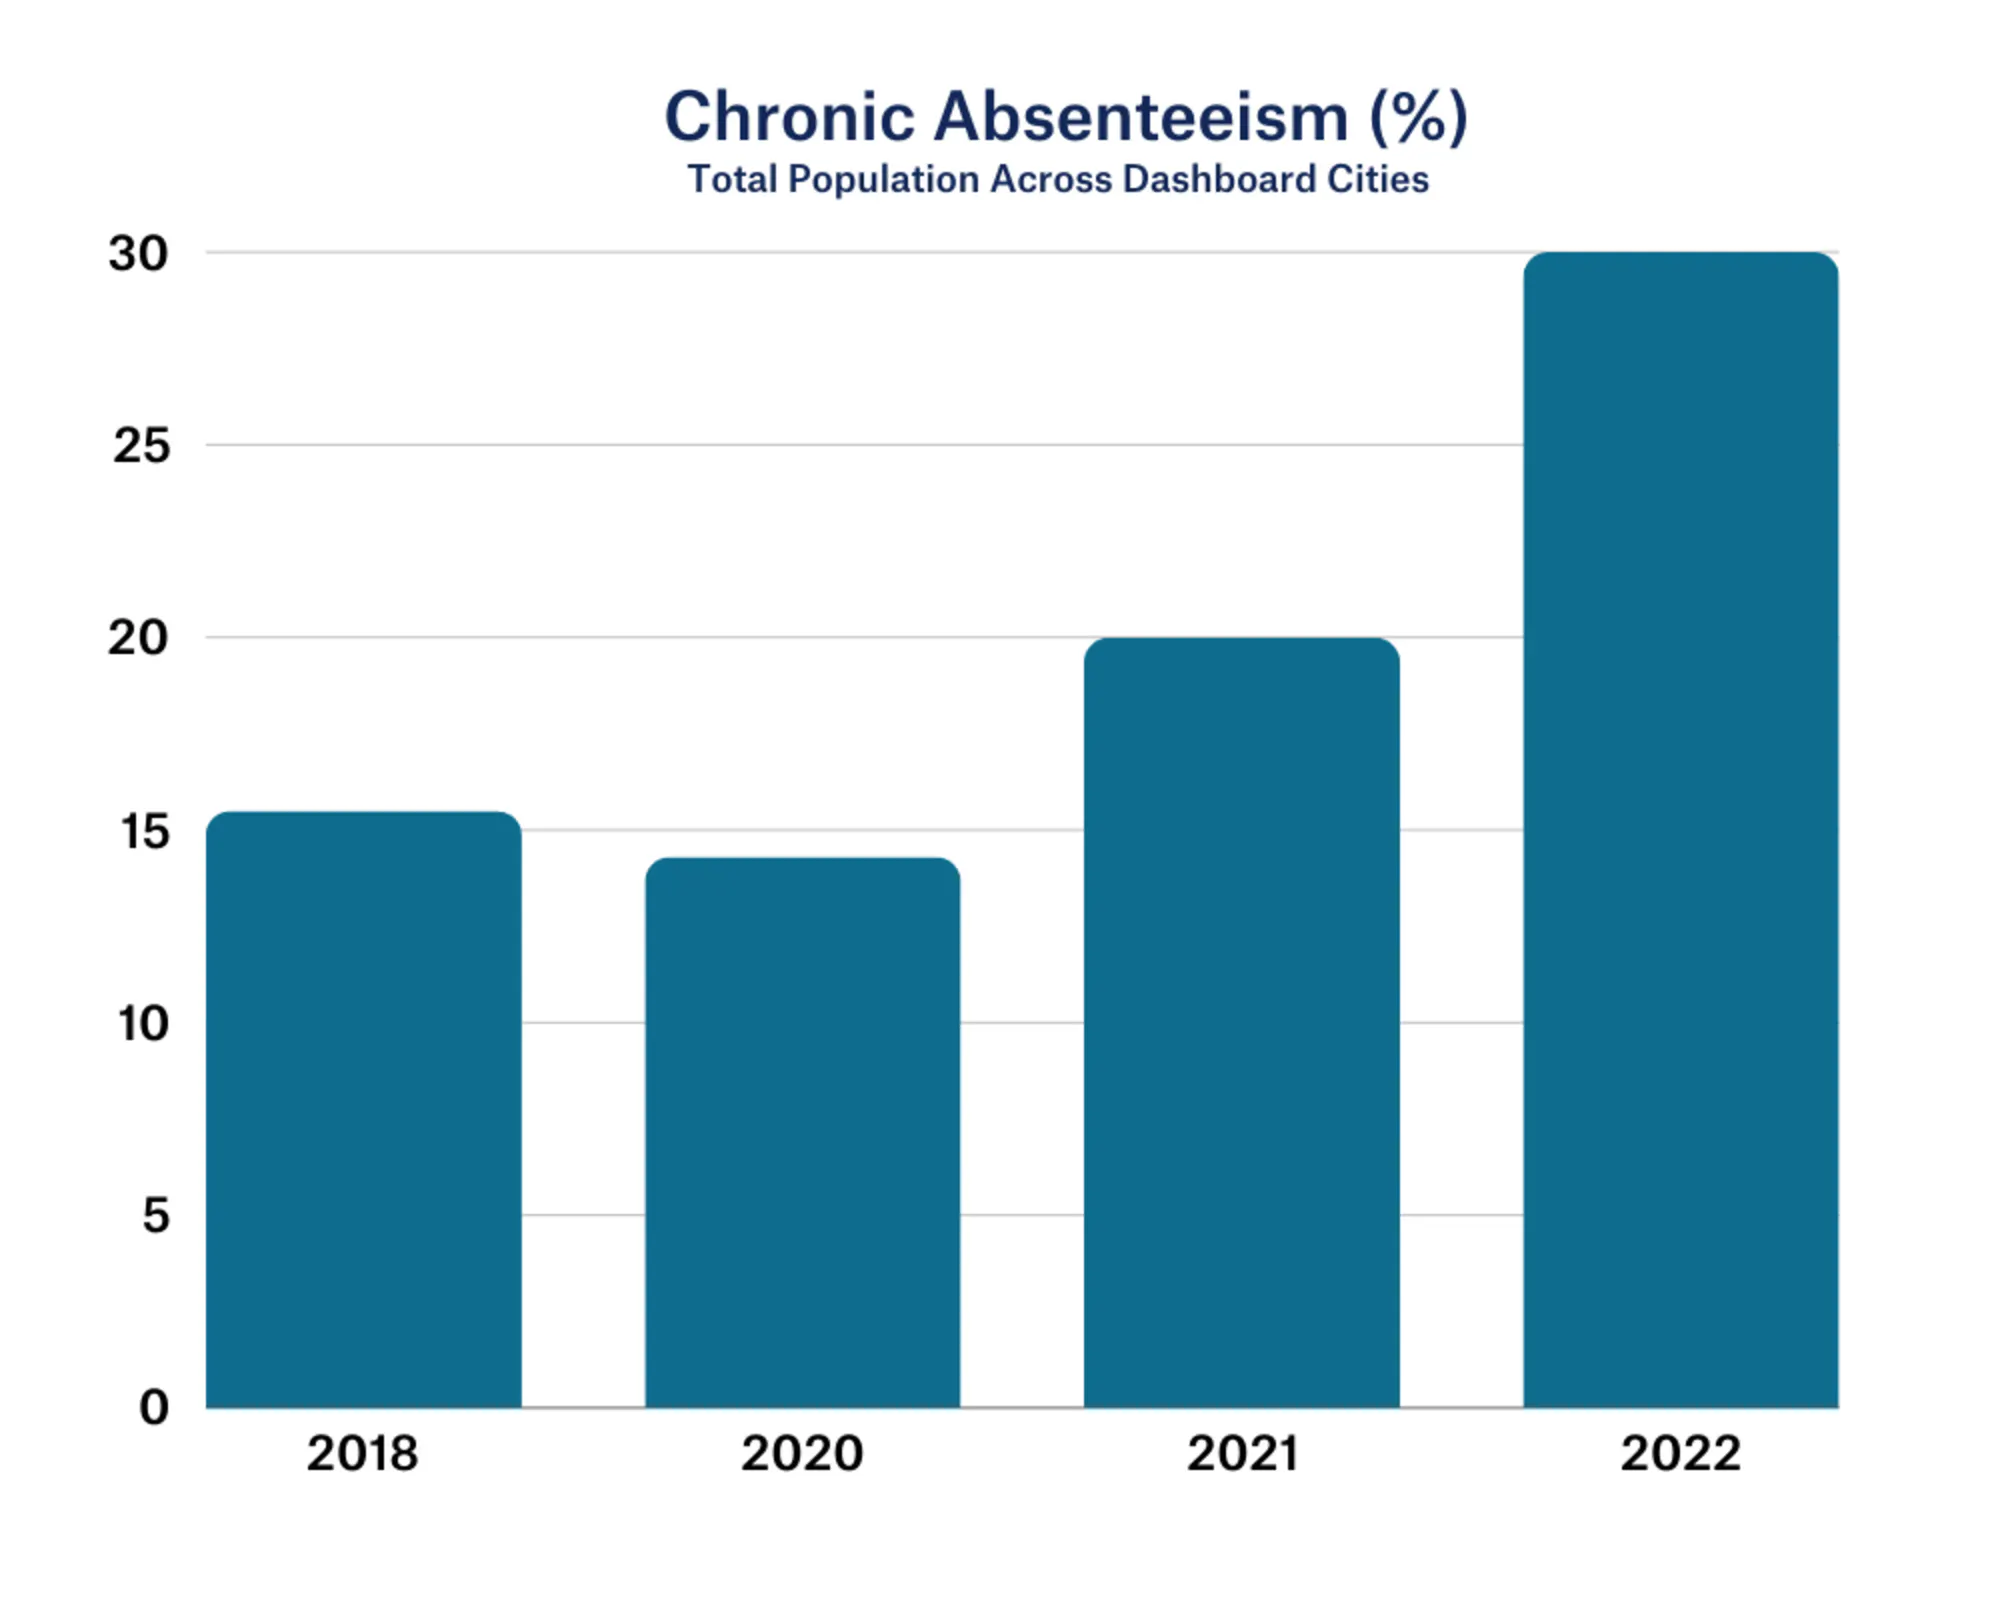
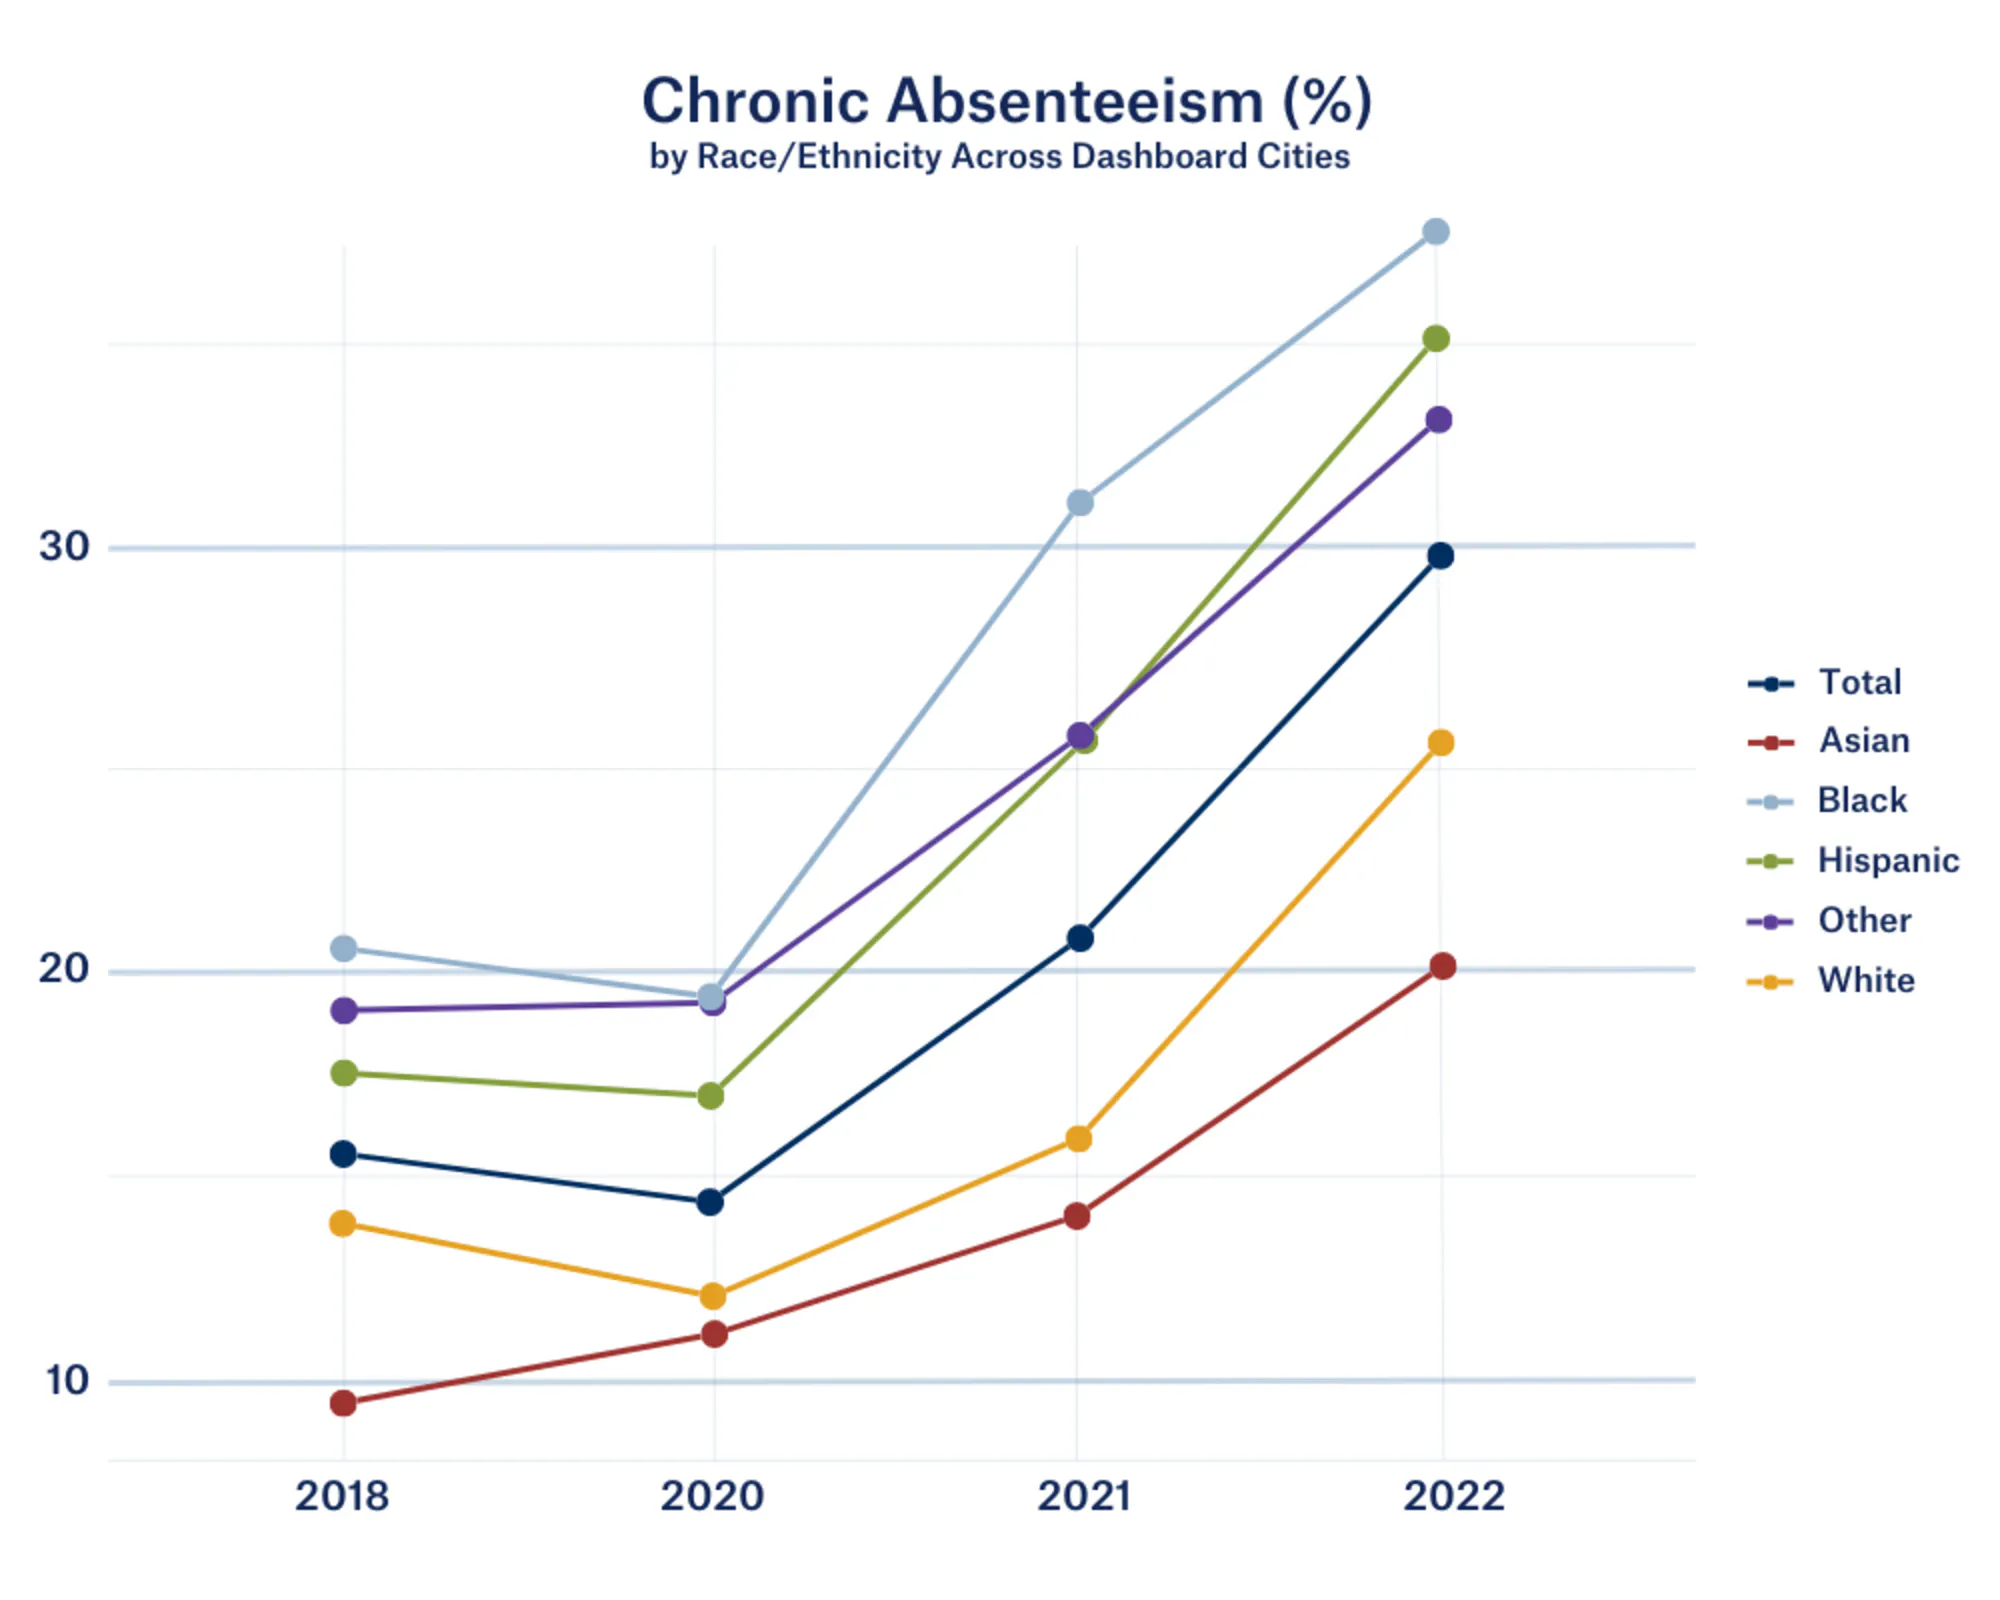
For example, structural factors, such as segregation, poverty, unpredictable work schedules, and interactions with the justice system, have historically contributed to disproportionately higher Chronic Absenteeism rates among some racial/ethnic minority students.3 In recent years, however, the COVID-19 pandemic contributed to rising Chronic Absenteeism rates across all demographic groups. Its effects are both widespread and pronounced. Compared to the 2017-2018 school year, reported national rates nearly doubled, reaching around 30% in school year 2021-2022.4 The average Chronic Absenteeism level across Dashboard cities mirrors this trend.
Understanding how the pandemic played out in schools is key to interacting with this data.
Understanding how the pandemic played out in schools is key to interacting with this data. At the start of COVID-19 shutdowns in America, in March 2020, student attendance data was reported with varying degrees of rigor throughout the nation. Some school districts simply stopped reporting attendance rates at the time of shutdown, so that “end-of-year” reported averages only reflected data up until the start of remote/hybrid learning, resulting in apparently lower than normal end-of-year absenteeism numbers.5 Others implemented more relaxed attendance policies in response to the trauma and upheaval caused by the pandemic and global shutdowns.6 Data-keeping structures were in flux as the majority of schools shifted to virtual platforms and fought to ensure that their students had access to internet and a computer.7,8

At the start of school year 2020-2021, staff and students continued to experience instability as schools struggled to provide safe yet effective learning environments for students. Virtual learning was improved, but still lacked the engagement and accountability of in-person experiences. In hybrid school environments, teachers struggled to teach with some students present physically and others participating via online platforms.9 Students and families grappled with how to protect their health all while working to maintain decent grades, manage social interactions, and plan for an unknown future. These challenges are reflected in school attendance, with average Chronic Absenteeism rates across Dashboard cities increasing by 45% during the 2020-2021 academic year.
By school year 2021-2022, many anticipated a return to “normal.” But more waves of variants hit, spurring additional disruptions to the school day and to school accountability.10 The social, emotional, and structural impacts of the pandemic proved to be long-lasting. Adjusting back to a routine of getting up and being present at school for a full day developed into an often insurmountable burden for many youth, as well as for the systems meant to support this routine, such as bus transportation to and from the school building, which suffered from a lack of staff and budget.2 Within-school systems continued to fluctuate to accommodate change, resulting in inconsistencies in expectations, supports, and data collection and reporting. More students simply refused to go to school each day, largely related to deteriorated mental health, motivation, and social anxieties.11,12 Chronic Absenteeism rates spiked again during the 2021-2022 school year, on average up to 30% across the nation, a doubling of pre-pandemic rates.4

COVID-19 and other communicable diseases are still concerns – many students fear getting sick themselves or bringing home germs that may infect at-risk family members.2 Other anxieties also pervade; students are arguably more connected to the outside world now than ever before. They, like many of us, are constantly exposed to news of school shootings, climate change, AI distortions, and wars abroad that only increase stress and strain mental health. Many school communities are not equipped to help students learn to manage these stressors and to understand that with everything going on in the world, it is still important to show up to school every day.11-13
Post-COVID, the barriers to creating the kind of cohesive community that fosters learning and encourages students to get to school have grown even more complex and continue to change rapidly. With all these factors at play, the doubling of Chronic Absenteeism rates becomes understandable, if not expected.
These trends are concerning.
In September 2023, the White House called for an “all-hands-on-deck approach” to addressing the substantial rise in Chronic Absenteeism rates, citing irregular school attendance as a “predictor of high school drop-out, which has been linked to poor labor market prospects, diminished health, and increased involvement in the criminal justice system.”14 How can cities use this knowledge and associated data to inform community-level action to diminish absenteeism?
School attendance is not tied exclusively to experience inside the school building. Many other influences contribute, including parent and community involvement, individual student well-being, and structural supports or lack thereof.11 The pandemic proved some school systems to be fragile, but they are made stronger when interconnected with other parts of the community. Cities can begin to build back connections between schools and surrounding communities by tackling questions of stability, health, and access.15 For example:
How can streets and modes of transportation be made safer and more reliable so that students have an easier time getting to school each day?
When a teacher reaches out to a parent or guardian to discuss their child’s presence in school, does the parent have reliable broadband or cellular service to receive the communication in a timely manner? How can access be more widely available?
How might data collection and reporting systems be better communicated and integrated into school practice so that school staff can work with accurate and up-to-date student data when communicating with families?
Are school materials, including parent outreach, made accessible, in the language(s) of the surrounding community, and posted on the platforms that they engage with?
How might wider youth mental and emotional health concerns impact a student’s desire to make it to class or their perception of school safety and importance? What mental health supports can be put in place within and around schools to help students manage these anxieties?
School staff and teachers can only do so much. It is important to remember that they too benefit from consistency, supportive systems, clear expectations, and strong public health programs for their own well-being which will in turn equip them to better help their students. Often, the factors mentioned above that affect absenteeism along with larger, structural barriers, such as poverty and homelessness, are beyond a teacher’s control. Focusing on tangible supports, such as frequent food banks or free lunches for students and families, clear avenues to reach mental health care, consistency in related communications, and school expectations, can help support stability at school.16,17
Move from data to action.
Be sure to check out Chronic Absenteeism in your city. Other Dashboard metrics can help understand other factors that may be impacting attendance rates, such as Children in Poverty to assess community economic needs and Broadband Connection to help determine if students have access to high-speed Wi-Fi at home.18 Finally, take a look at the Take Action resources focused on Chronic Absenteeism for a curated list of programs, policies, and funding opportunities to support and lift up city-wide public school attendance. All these factors contribute to student and family health, and setting priorities that reflect local needs can make establishing and keeping to school routines more attainable.
References
Education USDo. Chronic Absenteeism in the Nation's Schools. 2016. Accessed 2023. https://www2.ed.gov/datastory/chronicabsenteeism.html
Mehta J. 3 years since the pandemic wrecked attendance, kids still aren't showing up to school. National Public Radio. https://www.npr.org/2023/03/02/1160358099/school-attendance-chronic-absenteeism-covid
R B. The importance of being in school: A report on absenteeism in the nation's public schools. The Education Digest. 2012;78(2):4.
Dee TS. Higher Chronic Absenteeism Threatens Academic Recovery from the COVID-19 Pandemic. 2023
Education USDo. Data from: Chronic absenteeism--Students absent 10% or more school days. 2020.
Staff C. Grades, attendance, devices: What you need to knoew about remove learning in NYC. https://www.chalkbeat.org/newyork/2020/4/17/21230495/grades-attendance-devices-what-you-need-to-know-about-remote-learning-in-nyc/
Auxier B. As schools close due to coronavirus, some U.S. students face a digital 'homework gap'. March 16, 2020 2020;
Weise K. Remote learning comes to America as coronavirus shuts schools. New York Times. https://www.nytimes.com/interactive/2020/03/10/us/covid-19-seattle-washington-home-schooling-remote.html
Calderwood B. Types of Hybrid Learning Models During Covid-19. 2020. https://study.com/academy/popular/types-of-hybrid-learning-models-during-covid-19.html
Nierenberg A. Can Schools Handle Omicron? New York Times. https://www.nytimes.com/2021/12/22/us/can-schools-handle-omicron.html
Zimmer A. These NYC teens overcame school refusal and made it to graduation. Chalkbeat. https://www.chalkbeat.org/newyork/2023/8/2/23815992/school-refusal-nyc-students-mental-health/
Julia Martin Burch P. School refusal: When a child won't go to school. Harvard Health Publishing. 2018;
Panchal N. The Landscape of School-Based Mental Health Services. KFF. https://www.kff.org/mental-health/issue-brief/the-landscape-of-school-based-mental-health-services/
House TW. Chronic Absenteeism and Disrupted Learning Require an All-Hands-on-Deck Approach. 2023. https://www.whitehouse.gov/cea/written-materials/2023/09/13/chronic-absenteeism-and-disrupted-learning-require-an-all-hands-on-deck-approach/#_ftn1
Blume H. What do L.A. students want most? Mental health help, an adult to listen, reliable tech. LA Times. https://www.latimes.com/california/story/2021-11-10/l-a-students-want-covid-mental-health-help-reliable-tech?campaign_id=0&emc=edit_csb_20211117&instance_id=0&nl=education-briefing®i_id=0&segment_id=0&te=1&user_id=e54be69add3d6dc111a82076a341830f
Sosnowchik R. Why does a food bank focus on school meals? Jan. 8, 2021, 2021. https://www.2harvest.org/end-hunger-together/stories/why-does-food-bank-focus-school-meals
Vey JS. Why local leaders should champion 'community schools' to improve student, family, and neighborhood well-being. Research blog. 2022. https://www.brookings.edu/articles/why-local-leaders-should-champion-community-schools-to-improve-student-family-and-neighborhood-well-being/#:~:text=Investment%20in%20community%20schools%20can,during%20and%20after%20school%20hours.
Anderson M. Nearly one-in-five teens can't always finish their homework because of the digital divide. 2018