Putting research into practice – Using the Dashboard to improve air quality and health in cities
Nov. 27, 2023
Dana Duong
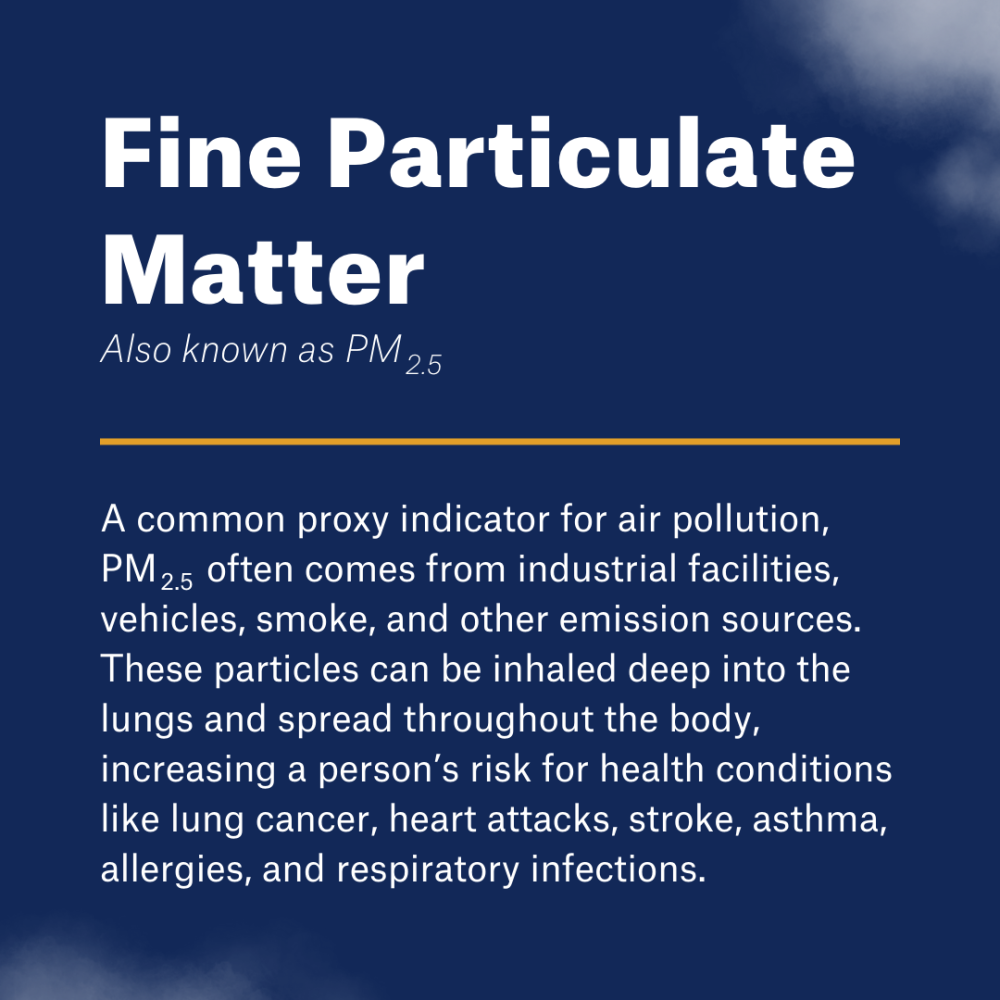
Air pollution is a well-documented cause of poor health outcomes across the globe, with fine particulate matter or PM2.5 as the most widely studied contributor to those adverse outcomes.1-3

PM2.5 can come from a variety of indoor and outdoor sources, like tobacco smoke, cooking appliances, car exhausts, wildfires, and industrial emissions. It is pervasive and that’s what makes it so dangerous. Across all exposure levels, the link between PM2.5 and health outcomes such as cardiovascular disease, stroke, and high blood pressure (HBP) is quite strong, and it is associated with 2.6 million premature deaths worldwide. When it comes to PM2.5 and our health, there are no “safe” exposure levels.4-5
Studying the impact of Personal Air Cleaners – Highlighting new research
High-efficiency indoor air filters, or “personal air cleaners” (PACs), have been proposed as a low-cost intervention to decrease indoor PM2.5 exposure and improve air quality. A team of researchers at NYU Grossman School of Medicine, including City Health Dashboard’s Co-Primary Investigator, Lorna Thorpe, are actively studying the benefits of in-home air filtration on indoor particulate matter concentrations and blood pressure. They conducted a pilot study in the homes of NYC public housing residents with diagnosed hypertension and found that in-home, PACs reduced systolic blood pressure (SBP) in non-smoking adults, including reduced self-measured home blood pressure in adults with hypertension living in urban public housing.6-7 The team is now conducting a large trial to verify the long-term impacts of PACs on blood pressure.
You can explore the meta-analysis and pilot trial if you are interested in learning more about how you can improve the heart health of your residents through this low-cost intervention to improve air quality.
Using the Dashboard to target your interventions
Cities and their decision makers can look to the City Health Dashboard to help them address air pollution where it matters most within their jurisdictions.
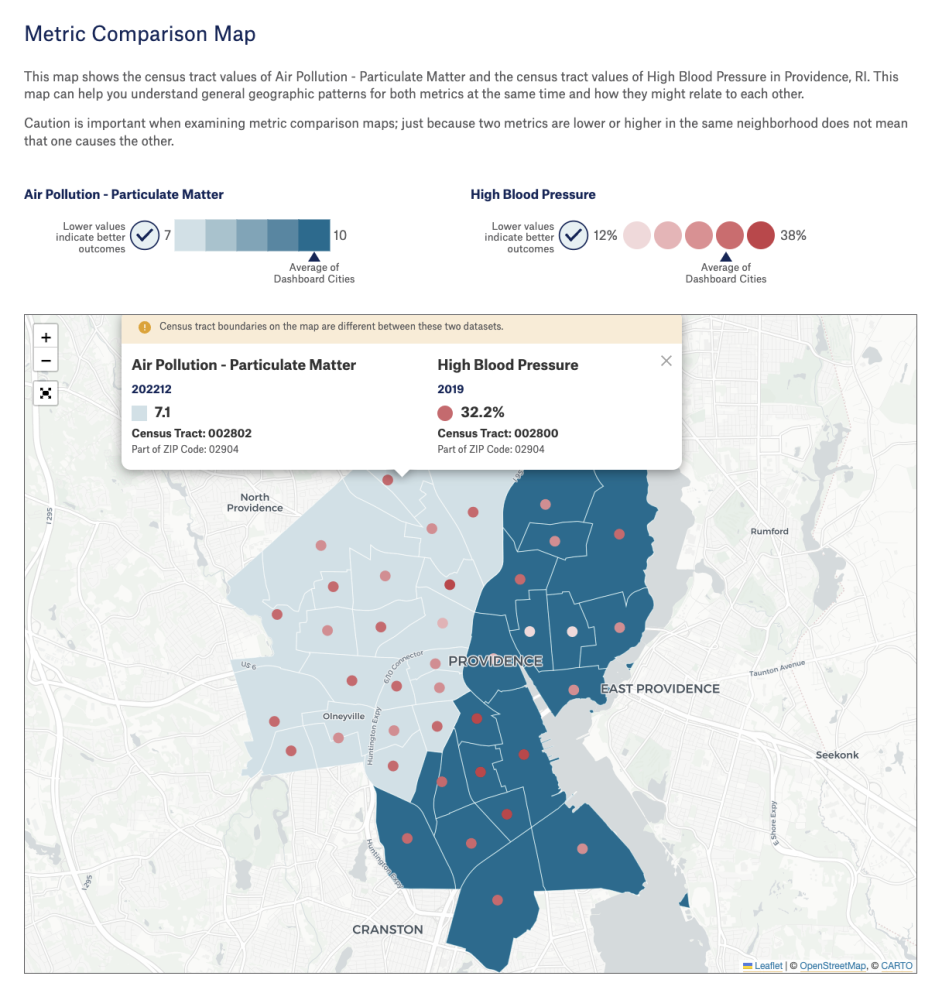
We provide neighborhood-level, monthly data on air pollution specific to PM2.5 from January through December 2022, neighborhood-level high blood pressure, and city-level data on cardiovascular disease deaths and premature deaths. With our Compare Metrics feature, users also have the ability to see how PM2.5 and high blood pressure relate to each other in neighborhoods across a city.

Public health leaders can use this information to locate neighborhoods that have high rates of hypertension and PM2.5, and target their efforts to deploy PACs to residents who could benefit most from this intervention, in order to improve air quality and help alleviate high blood pressure.
Explore air quality and heart health in your city and move from data to action with the City Health Dashboard.
References
Cohen AJ, Brauer M, Burnett R, et al. Estimates and 25-year trends of the global burden of disease attributable to ambient air pollution: an analysis of data from the Global Burden of Diseases Study 2015 [published correction appears in Lancet. 2017 Jun 17;389(10087):e15] [published correction appears in Lancet. 2018 Apr 21;391(10130):1576]. Lancet. 2017;389(10082):1907-1918. doi:10.1016/S0140-6736(17)30505-6
Babatola SS. Global burden of diseases attributable to air pollution. J Public Health Afr. 2018;9(3):813. Published 2018 Dec 21. doi:10.4081/jphia.2018.813
Al-Kindi SG, Brook RD, Biswal S, Rajagopalan S. Environmental determinants of cardiovascular disease: lessons learned from air pollution. Nat Rev Cardiol. 2020;17(10):656-672. doi:10.1038/s41569-020-0371-2
de Bont J, Jaganathan S, Dahlquist M, Persson Å, Stafoggia M, Ljungman P. Ambient air pollution and cardiovascular diseases: An umbrella review of systematic reviews and meta-analyses. J Intern Med. 2022;291(6):779-800. doi:10.1111/joim.13467
GBD 2015 Risk Factors Collaborators. Global, regional, and national comparative risk assessment of 79 behavioural, environmental and occupational, and metabolic risks or clusters of risks, 1990-2015: a systematic analysis for the Global Burden of Disease Study 2015 [published correction appears in Lancet. 2017 Jan 7;389(10064):e1]. Lancet. 2016;388(10053):1659-1724. doi:10.1016/S0140-6736(16)31679-8
Walzer, D., Gordon, T., Thorpe, L., Thurston, G., Xia, Y., Zhong, H., Roberts, T. R., Hochman, J. S., & Newman, J. D. (2020). Effects of Home Particulate Air Filtration on Blood Pressure: A Systematic Review. Hypertension (Dallas, Tex. : 1979), 76(1), 44–50. https://doi.org/10.1161/HYPERTENSIONAHA.119.14456
Wittkopp S, Anastasiou E, Hu J, et al. Portable Air Cleaners and Home Systolic Blood Pressure in Adults With Hypertension Living in New York City Public Housing. J Am Heart Assoc. 2023;12(13):e029697. doi:10.1161/JAHA.123.029697