2021 Year in Review
Dec. 15, 2021
Samantha Breslin
2021 is coming to a close; another year in the books. Though the COVID-19 pandemic continued to take its toll on cities and communities across the globe, there were also many moments and milestones to be proud of this year
Looking back on 2021, here are our top 10 highlights from the year and a sneak peek at what’s in store for 2022.
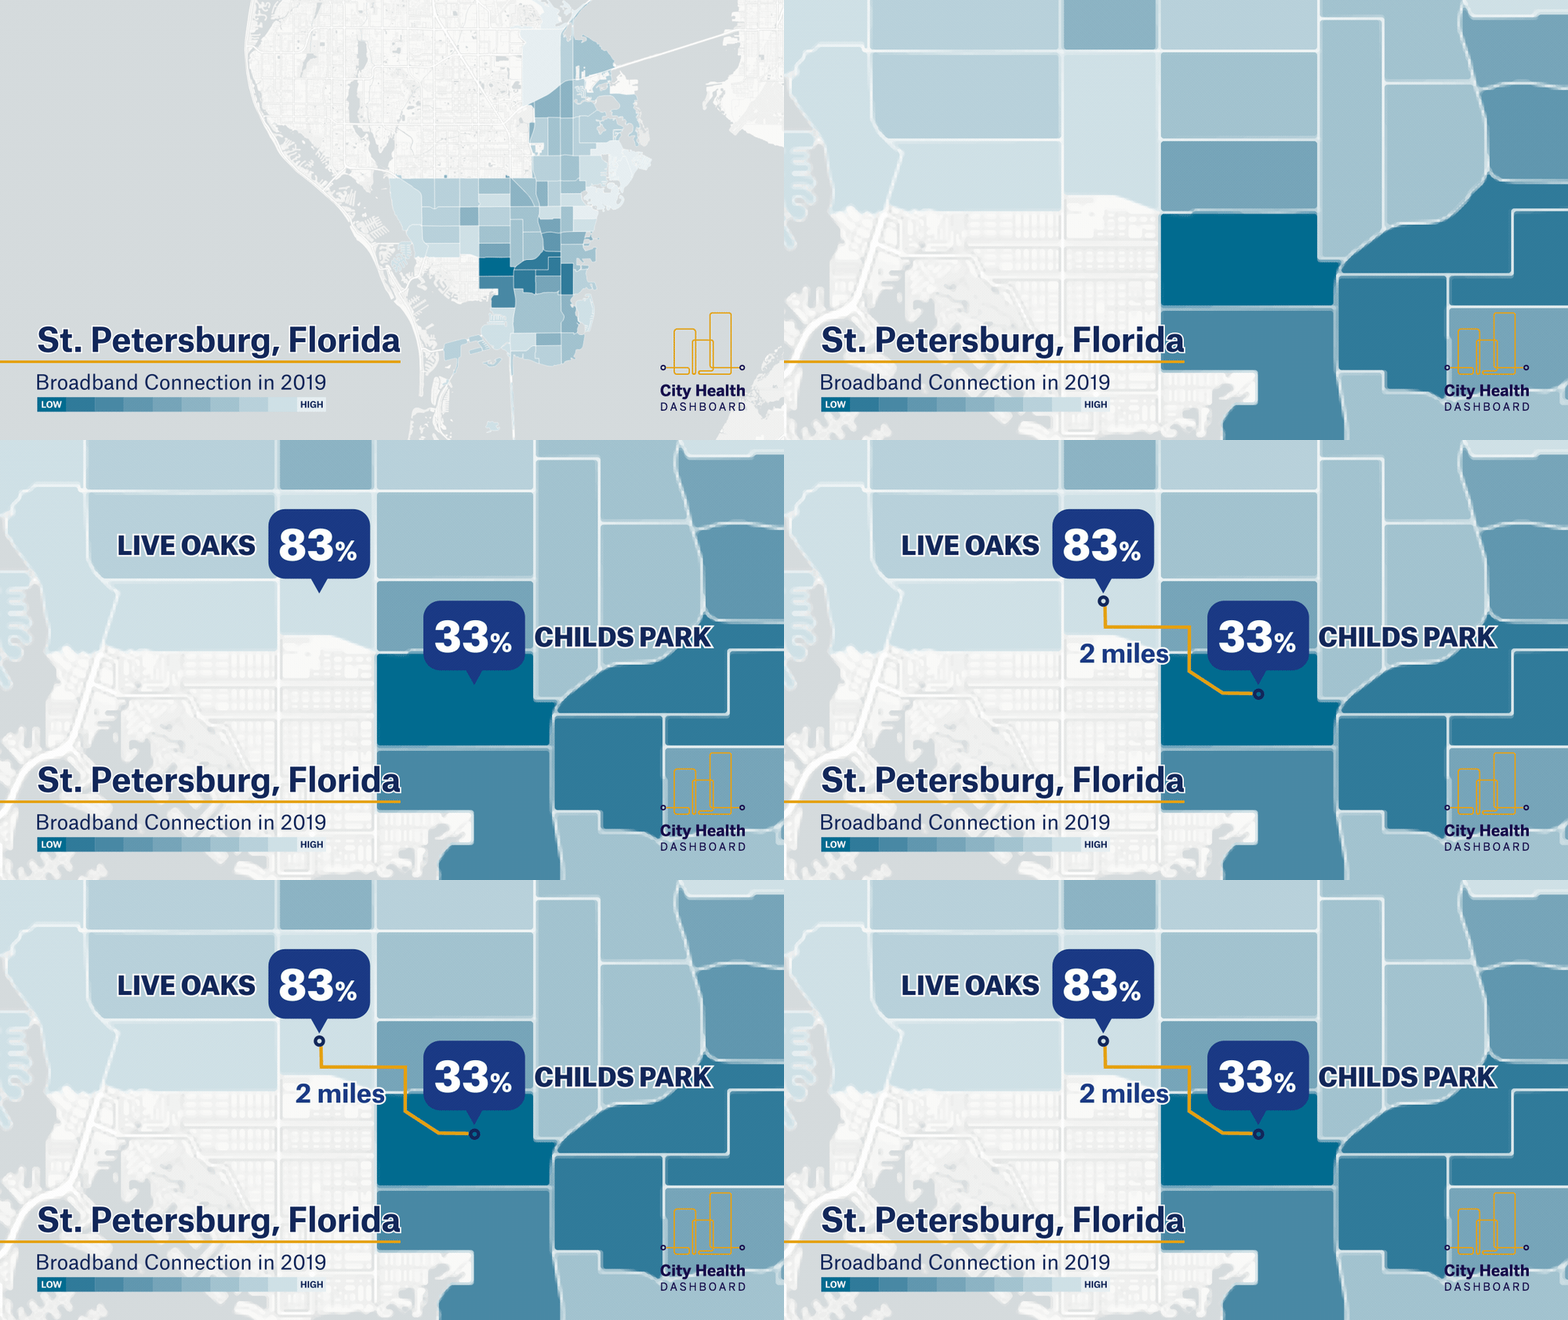
3 new measures 2021 was a busy year on the new metrics front. This year we added 3 metrics to the Dashboard: Broadband connection, routine checkups, and third-grade reading scores.
Data Insights launch Data Insights are deep-dives into City Health Dashboard data, providing new perspectives on a metric, region, population or issue. In September’s inaugural installment, we focused on broadband connection and why it matters for health. Read the Data Insight.

New and improved City Health Dashboard website This summer, we released exciting website updates to support your data journey including streamlining site navigation and refreshing the homepage, which make it easier and more intuitive to find what you need on the site – and be inspired to drive change wherever you are. Explore some of the updates:
Impact Stories to highlight how communities across the country are using the Dashboard.
Downloadable maps and scale bars available from every metric detail page for every Dashboard city.
An Events page to find opportunities to engage with the Dashboard team.
Research & Reports page that collects Data Insights, peer-reviewed articles, reports, and data visualizations from our team.
Video series: Moving from data to action To support those looking to explain how to use the tools offered on the Dashboard, we developed four short videos that make it easier to inspire you and your collaborators. See how Donna, Chris, Ann, and Leslie use the Dashboard to move from data to action in their fictional city of Pawnee, Indiana.
Education pilot program for high school teachers This fall, we developed two high school-level lesson plans to introduce health, the social determinants, and data visualization to students using the City Health Dashboard as a tool. These lessons are currently being pilot-tested in classrooms across the country, before being finalized and available for all high school teachers in the next few months.
New Health Equity Blog Series Health equity is at the core of our work here at the City Health Dashboard. In our Health Equity Blog Series, we explore issues impacting health and health equity in underrepresented communities and cities around the country. Read our blogs in the Series.
Emerging research Our team is committed to adding to the knowledge base about urban health, the social determinants of health, and spatial epidemiology and have been hard at work on publishing new research this year. See what we’ve published:
Re: ‘Academic Productivity Differences by Gender and Child Age in Science, Technology, Engineering, Mathematics, and Medicine Faculty During the COVID-19 Pandemic,’ by Krukowski et al. Tiffany Donley, Pei Yang Hsieh, Andrea Barnes Grant, Chigozirim Izeogu, Arlener D. Turner, Natasha Williams. Journal of Women’s Health.
Neighborhood-level Asian American Populations, Social Determinants of Health, and Health Outcomes in 500 US Cities. Ben R Spoer, Filippa Juul , Pei Yang Hsieh , Lorna E Thorpe Marc N Gourevitch, Stella Yi. Ethnicity & Disease.
Social and Economic Differences in Neighborhood Walkability Across 500 U.S. Cities. Sarah E. Conderino, MPH; Justin M. Feldman, ScD; Benjamin Spoer, PhD; Marc N. Gourevitch, MD; Lorna E. Thorpe, PhD. American Journal of Preventative Medicine.
Team growth The Dashboard is nothing without the smart, passionate, and hard-working team members that power all aspects of our website. This year, we were joined by 3 amazing new members– Farhana Haque, Yuruo Li, and Isabel Nelson. Learn more about them.
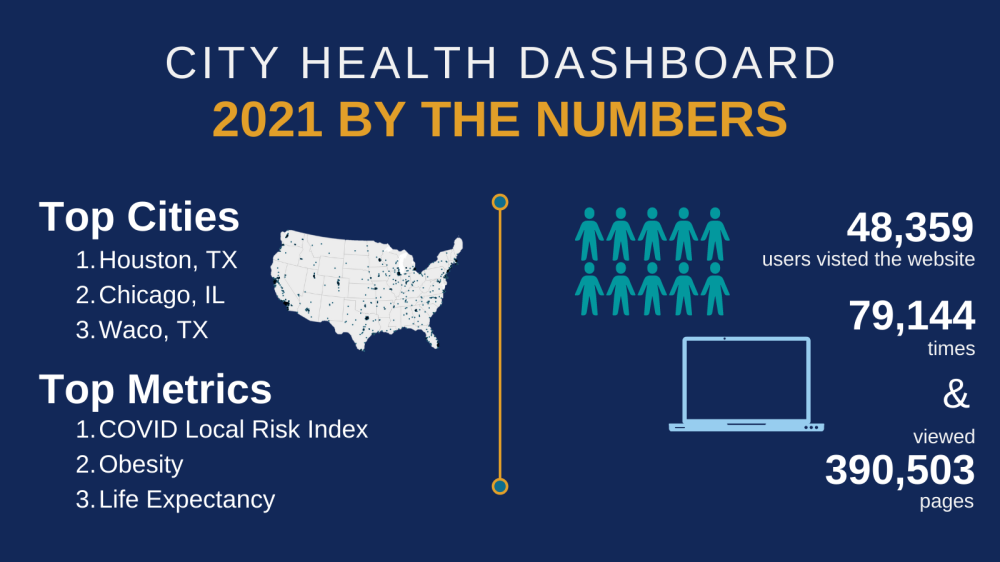
150,000 Users (and counting) We reached an exciting and important milestone this year – more than 150,000 people have visited and used the City Health Dashboard since launching in May 2018, contributing to over 1 million pageviews! Here’s to the next 150k! We've also rounded up our 2021 website snapshot. Check out the City Health Dashboard by the numbers:

Looking forward to 2022 We already have our eye on 2022 and are excited for all that’s to come next year. Next year, users can expect to see even more new measures, additional cities, new geographies to expand our reach across the United States, and more. Stay tuned and stay updated by signing up for our newsletter and connecting with us on Twitter and LinkedIn.
Happy holidays from the City Health Dashboard – See you in 2022!