The Dashboard Turns 5 Years Old!
Jun. 21, 2023
Samantha Breslin & Caleigh Paster
The City Health Dashboard turns FIVE years old this month! Since our launch in 2018, our mission has always been to support city and community leaders in driving positive change towards health and equity for local populations. Now, five years later, it’s with real pride and excitement that we reflect upon this journey, from a small pilot project to becoming a leading provider of public health data for over 900 cities.
And what better way to do that than by hearing from users and city leaders themselves on how the Dashboard has made an impact on the work that they do.
Looking back from where we were…
When we launched the site in June 2018, the Dashboard consisted of just four cities, four employees, and an idea. We recognized the need for accessible and comprehensive health data at the city and neighborhood-level and, just as importantly, that city leaders were eager for resources to help them inform decision-making at the local level. Armed with this belief, we set out to develop a platform that would change the way cities envision and take action to improve health and equity in their communities.
...to where we are now
Steadily, with support from our funder, the Robert Wood Johnson Foundation, and our partners like Forum One, Burness Communications, NLC, and ICMA (to name a few!), and with consistent feedback from our users across the country, we have grown tremendously. Today, we proudly serve over 900 cities with 43 metrics and new, dynamic features that help our diverse audience of users move from data to action in their communities – whether as policymakers, researchers, educators, health practitioners, journalists, or community members.
Since launching, we’ve increased our product offering, decreased the population threshold to allow for more cities to be included on the Dashboard, and improved the user experience to support accessibility – all with the goal of equipping city and community leaders with tools to improve the health and well-being of their residents. Here are some highlights of the Dashboard’s growth over the last five years:
In 2020, we started providing data on smaller cities. Now, 40% of all of the cities covered on the City Health Dashboard have populations less than our original threshold of 66,000. Our goal is to continue adding smaller communities onto the Dashboard through initiatives like the Put Us on the Map Challenge.
Using our learnings and best practices from the City Health Dashboard, we launched a new website, the Congressional District Health Dashboard, in January 2023, in partnership with the Robert Wood Johnson Foundation. This site provides health and equity data for all 435 U.S. Congressional Districts, to drive state and national policymaking around health and its drivers.
Change takes time, and we’ve started capturing Impact Stories to show how communities are putting data to work locally, including using data for community health assessments, COVID response and recovery, and linking school performance with health outcomes.
Our team has been using the Dashboard’s data for research and we are committed to adding to the knowledge base about urban health, the social determinants of health, and spatial epidemiology. Check out research we’ve published here.
We’ve grown our partnership network to expand our expertise, share knowledge, and disseminate novel metrics through the Dashboard. Partners like Everytown for Gun Safety, the RESTORE Network, NASA and George Mason University are essential to the work that we do.
“Looking back on our pilot with just 4 cities, and having watched that grow into the coverage and impact of the City Health Dashboard today, I’m even more excited about the next five years,” explains Dr. Marc Gourevitch, the primary architect and principal investigator for the City Health Dashboard. “The Dashboard has helped connect so many communities to actionable data, and yet we have more ground to cover to make public health data more timely, granular, and actionable.” We aim to help lead that conversation, with our partners and with city and community leaders like you, to make sure Dashboard data, and federal datasets more generally, are serving the needs of community changemakers.
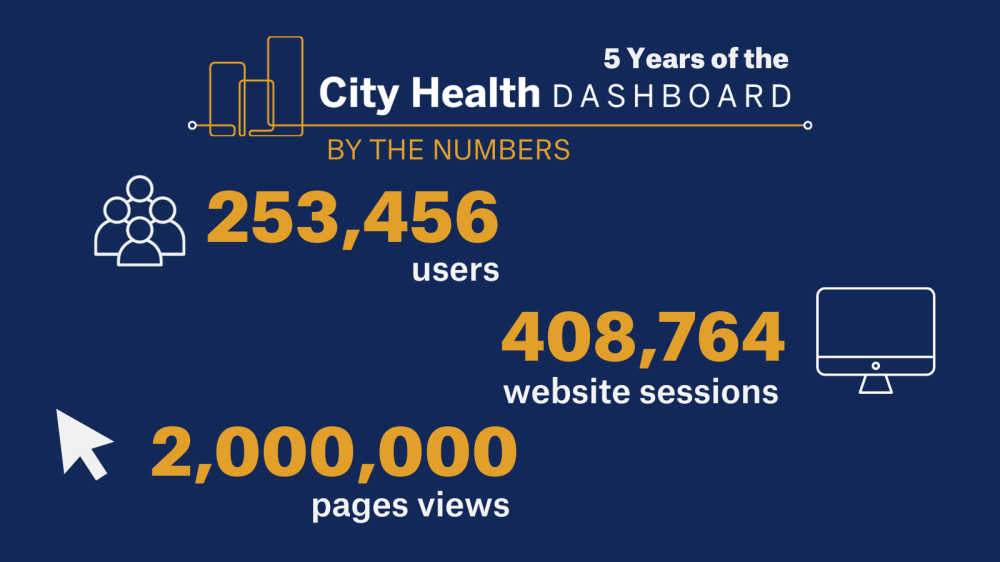
Five Years of the Dashboard: By the Numbers

Top Metrics:
Children in poverty
Life expectancy
Diabetes
Obesity
Income inequality
Explore all of our metrics here.
Top Blogs:
Explore all of our blogs here.
Top Cities:
New York, NY – explore New York
Chicago, IL – explore Chicago
Houston, TX – explore Houston
Waco, TX – explore Waco
Baltimore, MD – explore Baltimore
Boston, MA – explore Boston
Memphis, TN – explore Memphis
Philadelphia, PA – explore Philadelphia
Austin, TX – explore Austin
Los Angeles, CA – explore Los Angeles
Explore your city here.
Thank you for being a part of this journey! We look forward to continuing to build and grow the Dashboard over the coming years to help cities across the country as they work to improve health and equity in their communities.
If you have a question, want to get in touch, or have a story worth sharing, please reach out to us at [email protected].